Computer Science Graduate | Data Analyst & Aspiring Data Scientist
Blending technical precision with business insight to turn complex datasets into actionable outcomes. Skilled in Python, SQL, and BI tools, with a focus on healthcare and financial analytics.
Jersey City, NJ
Graduated May 2025
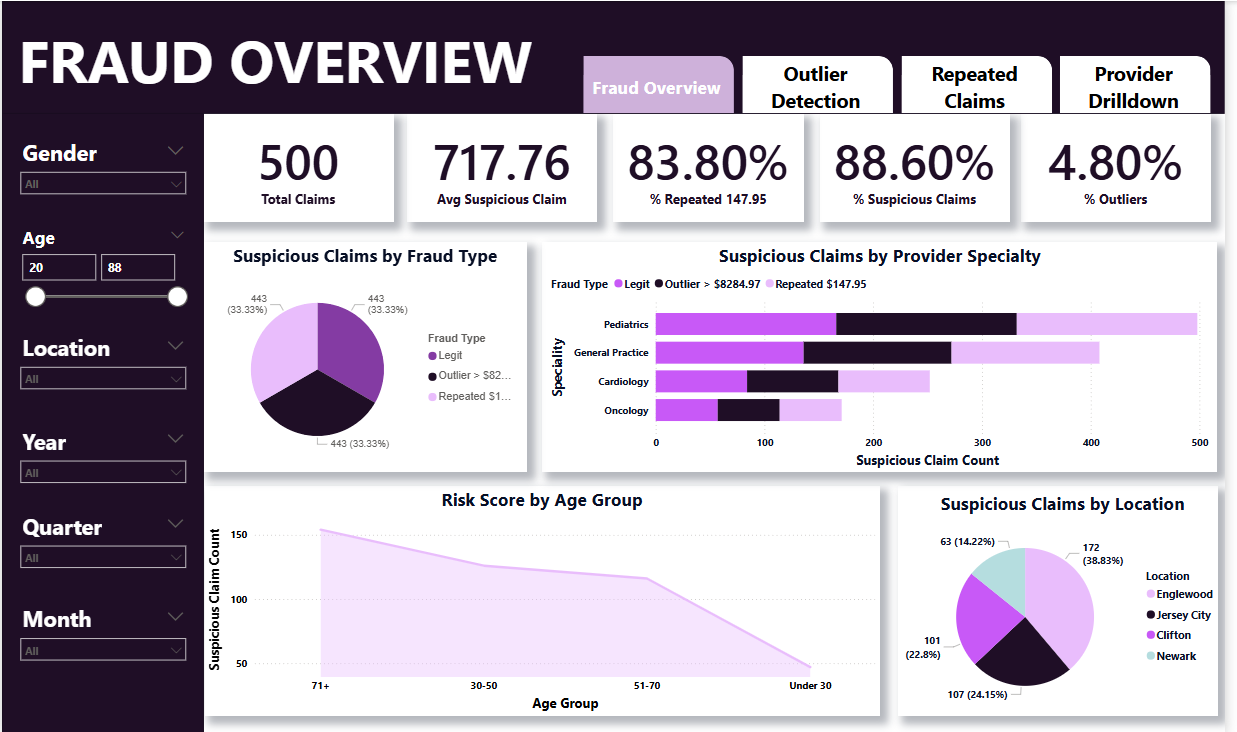
Curious by nature and analytical by training, I thrive at the intersection of code, context, and communication. I enjoy exploring patterns in complex datasets and translating them into insights that drive impact—whether that means uncovering hospital charge disparities or building tools for financial forecasting.
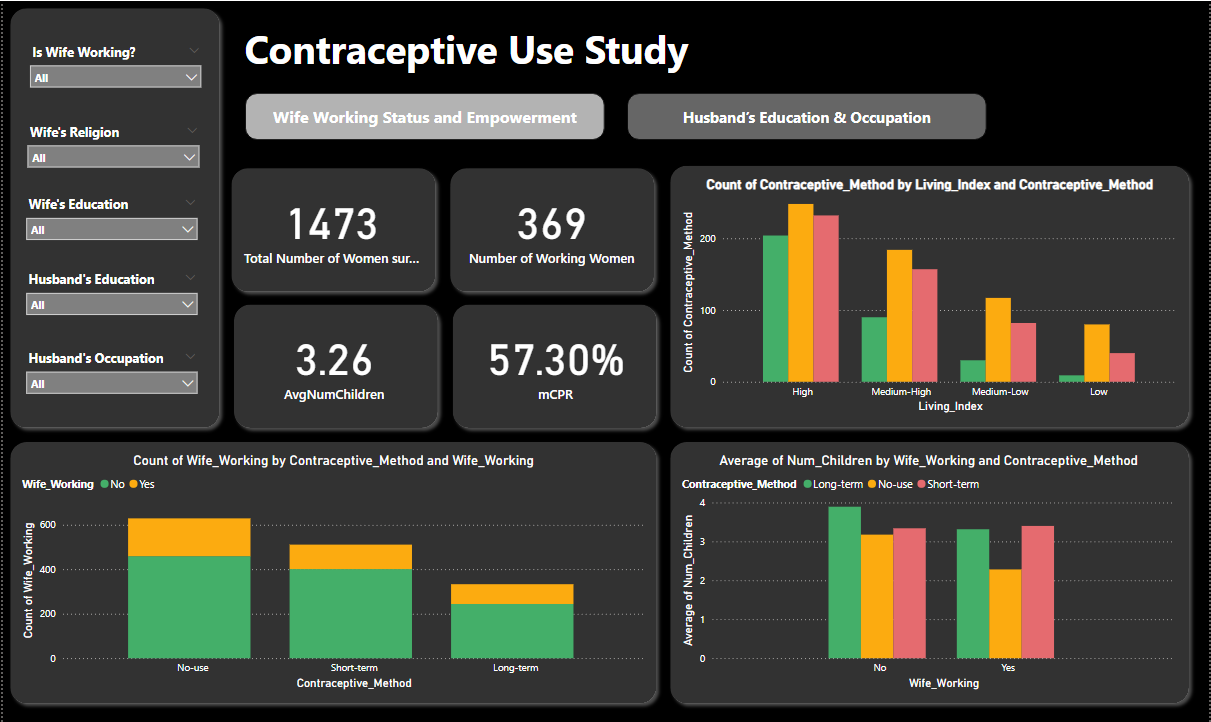
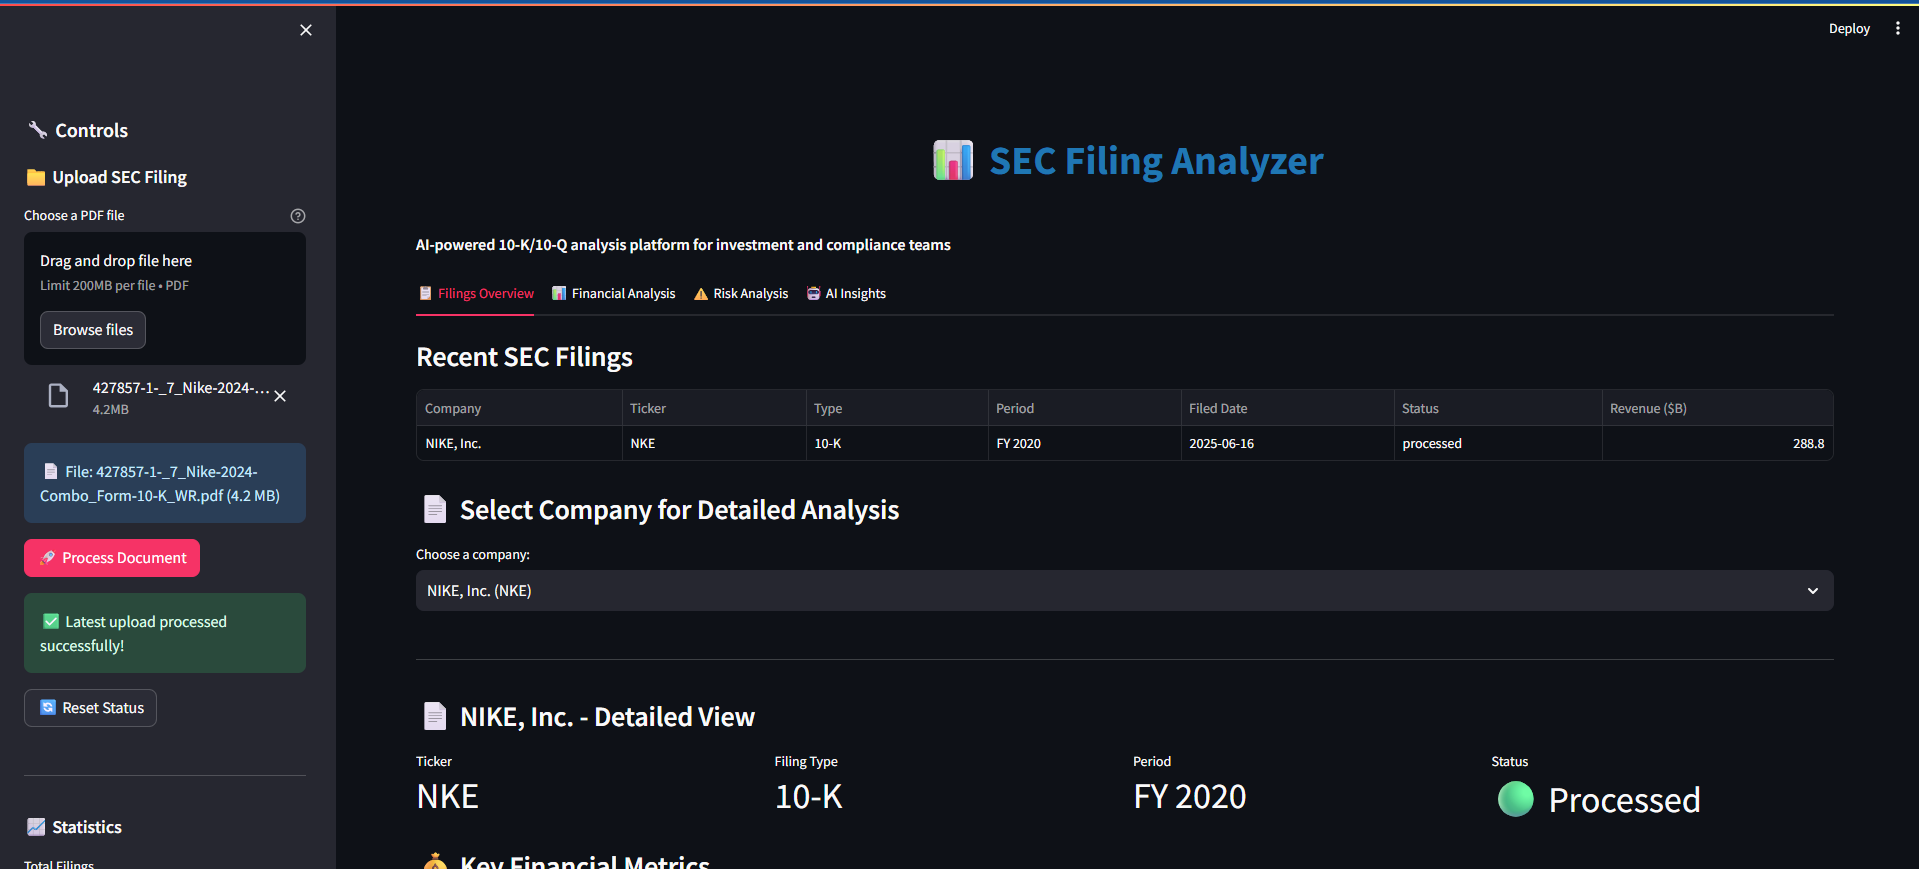
I'm a Computer Science graduate with a minor in Accounting, passionate about using data to solve real-world problems in healthcare, finance, and public policy. I work across the full data stack—from preprocessing and feature engineering to model building and deployment—using tools like Python, SQL, Power BI, and Streamlit.
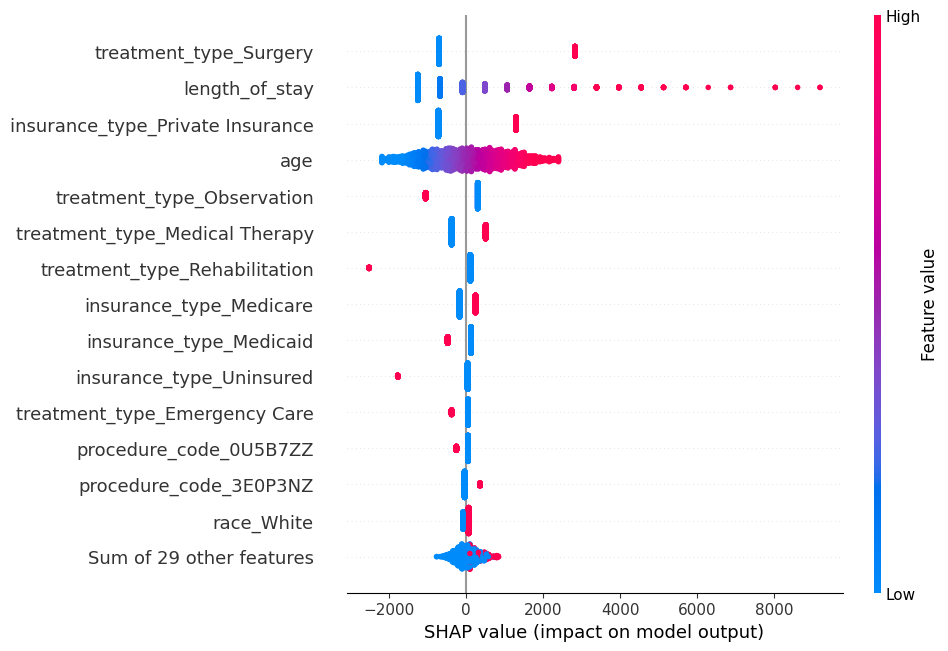
I value fairness, clarity, and continuous learning. Whether I'm developing a regression model, interpreting SHAP values, or refining a dashboard's design, I bring a mix of precision and creativity to every project. Outside of data, you'll find me diving into tech podcasts, exploring new AI tools, or helping friends debug Excel formulas they didn't ask me to look at 😊.
Here are the technologies and tools I work with to bring ideas to life.
A collection of projects that showcase my skills and experience in web development.
A machine learning app that forecasts hospital charges based on patient demographics, diagnosis, treatment type, and insurance. Built with Python and Streamlit, the project incorporates SHAP for model transparency and Fairlearn to ensure equitable predictions across race and gender. Designed to support healthcare price transparency and policy insights using synthetic data.
Built a healthcare fraud detection pipeline using SQL, Python, and Power BI to flag suspicious insurance claims. Identified statistical outliers and repeated billing patterns (e.g., >50% of claims at $147.95 via SDV artifact). Applied window functions and drillthrough dashboards to visualize provider-level risk profiles.
Developed an interactive Power BI dashboard analyzing contraceptive choices among Indonesian women using demographic, occupational, and media exposure data. Integrated DAX KPIs and Python preprocessing to uncover insights on fertility, education, and empowerment.
Built an AI-powered Streamlit app that extracts and analyzes SEC 10-K/10-Q filings using NLP techniques and PDF parsers. Transforms unstructured documents into structured insights with interactive dashboards for financial metrics, risk factors, and sentiment analysis.
Performed DCF and Comparable Company valuation for Adobe Inc. using Python and Excel. Automated data retrieval via yFinance and built interactive Plotly dashboards to visualize free cash flows, WACC, risk, and market multiples. Determined a ~63% overvaluation vs intrinsic value.
Conducted an R-based exploratory analysis to examine bias in Fandango's movie ratings before and after 2015 media criticism. Compared ratings from IMDb, Metacritic, and Rotten Tomatoes using box plots, correlation heatmaps, and distribution visualizations. Highlighted inflated scoring and platform inconsistencies.
Designed a Power BI dashboard using data from Our World in Data and Kaggle to track global COVID-19 vaccination trends by country, region, and age group. Used Python for preprocessing and DAX for KPIs like booster uptake and elderly coverage. Highlighted disparities across income levels and their impact on public health outcomes.
Professional certifications that validate my skills and expertise in various technologies.
Get in Touch!